How Do They Measure Up?
Examining Drug Use Surveys and Statistics
Part II: The Problems
Nov 2005
Citation: Erowid E, Erowid F. "How Do They Measure Up? Part II: The Problems". Erowid Extracts. Nov 2005;9:16-21.
see also: Part I: The Sources
Although drug use and drug market statistics are used to inform and support policies, court decisions, and academic research affecting entire societies, there is currently no way to reliably and directly measure how many people use illegal or recreational psychoactive drugs. Survey data is compiled in an attempt to determine usage across an entire population, but many problems plague this approach."There are right ways and wrong ways to show data; there are displays that reveal truth and displays that do not."
— Edward Tufte, Professor Emeritus of Statistics and Information Design at Yale University
Second, results published by survey organizations are extrapolations based on relatively small quantities of data and a range of assumptions. All of the major surveys use "imputation" techniques and statistical methods that yield highly processed data tables. Very few of the large studies present their raw data in a publicly available format. Imputation is used to fill in answers that were skipped by respondents, to correct for known collection problems, and to remove anomalous measurements. The data is also both extrapolated and massaged to try to keep it consistent with previous years.2
Finally, and perhaps most problematically, many people are exposed only to highly filtered results in the mainstream news. The general understanding of how trustworthy these publicized results are is quite low.
This article is not intended to dismiss survey results, but rather to point out some of the problems involved with attempting to measure psychoactive drug use through surveys and with drawing specific conclusions from their results.
"While working on the 2000 NHSDA imputations, a programming error was discovered in the 1999 imputations of recency of use, frequency of use, and age at first use for several drugs. This error resulted in overestimates of past year and past month use of marijuana, inhalants, heroin, and alcohol." 1
— National Household Survey
Simple Survey Errors
Although the major surveys are well-funded and heavily scrutinized, attributing too much importance to any single data point can lead to inappropriate interpretations. As might be expected, given a complex process of data collection and interpretation, a variety of simple errors (sometimes called "non-sampling errors") can slip through. Flawed data recording, encoding, tabulation, or calculations can provide unexpected and incorrect results. Some of these errors are noticed quickly, while others are only found years after the data is published.For instance, in 1997, the National Household Survey on Drug Abuse (NHSDA or NHS) encountered a strange problem with survey administration. Surveyors recorded that nearly 10% of selected respondents over the age of 18 could not complete the survey because their parents refused to let them participate. The "parental refusal" category, usually reserved for minors, would generally be near-zero for adults. This bizarre error is briefly mentioned in a small footnote on the survey results hypothesizing it was caused by interviewer error: "Parental refusals for persons aged 26 or older were considered unlikely and may have been incorrectly coded by interviewers."3 It seems quite unlikely that numerous interviewers made the same error unless there was a problem with the survey itself. Alternately, the error could have resulted from problems with post-survey tabulation.
When glaring errors like these are found, it is a strong reminder that smaller errors are certainly present as well, some of which will have a perceptible effect on results. Many of these errors, especially in surveys conducted only once, will never be found or corrected.
Implementation Problems
Small changes or unforeseen problems with implementation can affect survey results in surprising ways. In 1999, the NHS noticed an unusual increase in reported lifetime use of "any illicit drug" among its surveyed population. Upon further investigation, researchers found that the experience of survey administrators who conducted pencil-and-paper interviews had a strong effect on reported levels of psychoactive use. "[D]ata collected by interviewers with no prior NHSDA experience resulted in higher drug use rates than data collected by interviewers with prior NHSDA experience." 6
This effect would not have been noticed except that the NHS had an unusually high number of new interviewers in 1999: new interviewers conducted 69% of NHS's paper-and-pencil surveys.5 In response, the NHS authors "adjusted" the reported lifetime use rates downward to account for the increase in inexperienced interviewers and to better match previous years. This disparity highlights the impact that even subtle changes in survey design and implementation can have on results and illustrates how much data massaging takes place prior to final publication.
Underreporting of Illegal Behavior
One fundamental problem with surveys measuring illegal and socially disapproved behavior is that people rationally fear repercussions for admitting such activities. Aside from the obvious legal consequences, being identified as an illegal drug user could significantly damage or even destroy many careers. Physicians, lawyers, teachers, daycare employees, airline pilots, and many others risk being sanctioned or even legally banned from holding those positions if their survey admissions were made public.Many respondents are aware that providing incriminating data to a surveyor holds risk. Media reports regularly describe the proliferation (and compromising) of databases containing private information; this is likely to condition survey respondents to ask themselves whether their answers could potentially end up in a database connected to their name. It begs credulity to assume that a vast majority of informed adults would be reliably honest about their use of illegal drugs.
"Are sensitive behaviors such as drug use honestly reported? Like most studies dealing with sensitive behaviors, we have no direct, totally objective validation of the present measures; however, the considerable amount of existing inferential evidence strongly suggests that the self-report questions used in Monitoring the Future produce largely valid data."10
Beyond the understandable hesitancy to admit crimes to strangers, there are also small but real concerns about trusting the legitimacy of survey workers. In one case during the 2000 U.S. census, police in Minnesota posed as census workers while investigating a suspected "drug house" to gather information about who lived at the house for a warrant.8 Even a few publicized cases of this type may have a significant impact on people's willingness to respond honestly to surveys.
The job of these surveyors is to get complete strangers to trust them with information that could expose them to enormous risk. Yet if respondents consulted with a lawyer first, they would almost certainly be advised not to admit illegal behavior to a stranger, even one conducting a supposedly anonymous survey. Researchers agree that these factors lead to underreporting of psychoactive use, but due to the nature of the problem it is largely unknown how much this impacts survey results.9
Cultural and Societal Effects
"[T]he degree of recanting of earlier drug use (that is, denying ever having used a substance after reporting such use in an earlier survey) varies by occupational status. Specifically, respondents in the military and those in police agencies are more likely to recant having used illicit substances."15
Confusingly, the same factors that affect levels of psychoactive use, such as perceived acceptance or disapproval of any particular drug, are also likely to affect willingness to admit to such use on a survey. These factors may include current political climate (national or local), anti-drug commercials on TV, drug-related media reports about arrests or health issues, current movies or TV programs depicting drug use, etc. Although the issue of societal factors affecting results is acknowledged by both NHS and MTF,12 it is rarely addressed seriously and could represent a fundamental confounding effect on the meaningfulness of surveys data.
The Maturity Recanting Effect
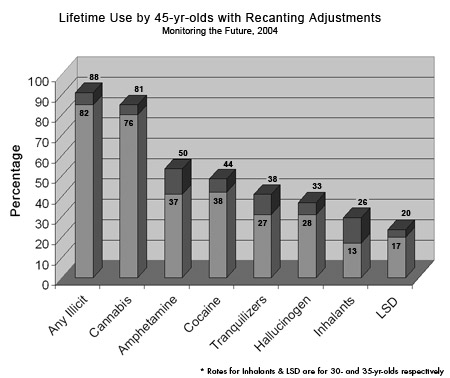
One of the most interesting effects documented by MTF is the "recanting effect" among people surveyed at multiple points over many years. Each year, MTF selects 2,400 of the 15,000 high school seniors surveyed to undergo follow-up interviews every other year through age 30 and once every five years thereafter. These follow-up surveys have been conducted since 1976. As of 2003, data now exists for a cohort of 45-year-olds who have been surveyed regularly for more than 25 years. MTF defines someone as having recanted if they state on two different surveys that they have used a specific drug, and then in a later survey deny that use. Using longitudinal data, it is possible to track individuals who admit to illicit drug use and then later "recant".
Among respondents participating in follow-up surveys, recanting of previous use begins early and increases over time. According to MTF's 2003 data, there is already a 3.1% recanting rate by age 21. This increases by approximately .85% per year until age 30, at which point it stabilizes.13 At age 30, 10.8% of those respondents who have, on two previous occasions, admitted to the use of an illicit drug, change their answer and state that they have never used such a substance. These numbers are for people who have invested time and energy over the past 15-25 years participating in this long-term survey; it is quite possible that those participating in a single survey would be more likely to deny past use, knowing that there was no previous data to contradict.
Recanting rates vary significantly by substance, perhaps because of differences in their relative social acceptability. At age 35, recanting rates are lowest for alcohol (1.0%), cannabis (5.8%) and LSD (15%), and highest for tranquilizers (33.3%), amphetamine (43.7%), and inhalants (50.0%*).13
Although MTF offers several possible explanations for the recanting effect, including faulty memory of past experiences, or earlier exaggeration of use, the most obvious explanation is that people who are older and have more to lose are more likely to lie about illegal and socially disapproved behavior. This hypothesis is strongly supported by evidence that police and military personnel, groups with more reason to deny past illegal drug use, were twice as likely to recant than the general population.14
In the end, MTF and other surveys generally conclude that a majority of recanting is among people who have actually used these substances in the past. Following this conclusion, when estimating lifetime prevalence of use in the United States, MTF now includes recanters among people who have used each substance.
Based on these revised numbers, MTF estimates that 88% of 45-year-olds in the United States have tried an illegal drug at some time in their life and 81% have tried cannabis. By MTF's own account, these upwardly revised estimates are still likely understatements of actual use.13
Difficult-to-Survey Populations
Another major problem with most drug use surveys is that they fail to include difficult-to-survey populations. These include users with no stable address, those who do not answer their phone, those unwilling to participate in surveys, absentee students, high school dropouts, and others who may comprise some of the heaviest users of illegal drugs. Therefore, it is nearly universally accepted that the major surveys under-report use of the most disapproved psychoactives and heavy use in general.Under-reporting in difficult-to-survey populations is particularly problematic for drugs with lower prevalence of use in the general population and for those drugs where regular use is believed to begin after age 18 (and thus not covered by "youth" surveys such as MTF):
"In the case of heroin use--particularly regular use--we are most likely unable to get a very accurate estimate [...]. The same may be true for crack cocaine and PCP. For the remaining drugs, we conclude that our estimates based on participating seniors, though somewhat low, are not bad approximations for the age group as a whole."16
| Surveys Track LSD Shortage |
|
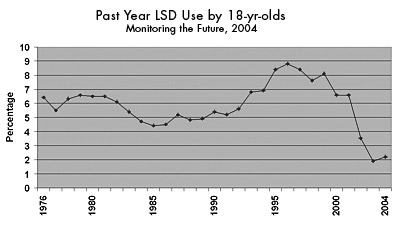
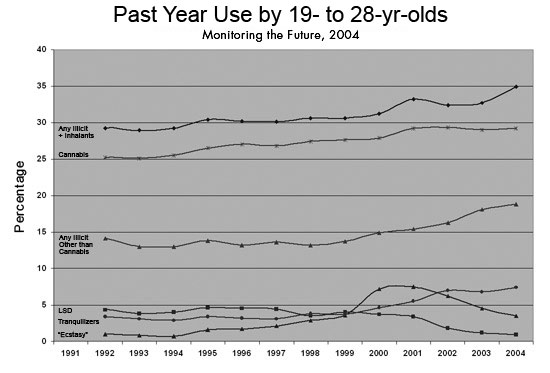
Perhaps one of the most surprising and striking examples of external validation for the NHS and MTF in recent years can be seen in the decline of LSD availability. According to these surveys, LSD use was relatively stable through the 1990s, with estimated past-year use among high school seniors fluctuating between 5.4% and 8.8%. But in early November 2000, the discovery and shut-down of a large LSD lab seemed to be one of the first major successes of the DEA in its attempt to halt the production and distribution of LSD. Beginning in the summer of 2001, people began reporting major shortages of LSD on the underground market. Speculation mounted that the Kansas silo arrests were responsible for the perceived shortage. Due to the nature of the secretive underground markets, it was impossible to know for sure how widespread the actual shortfall of supply was. However, the major psychoactive surveys have been able to confirm this shortage, which has in turn been able to partially validate the survey statistics. Between 2000 and 2003, MTF showed an unprecedented drop in past-year LSD use by high school seniors, from 6.6% to 1.9%.13 During the same period, the NHS's measure of newly initiated LSD users dropped from 788,000 to 320,000.23 Similarly, between 2000 and 2002, DAWN Emergency Department mentions related to LSD dropped from 4,016 to 891.24 Although these surveys may not be highly accurate in estimating exact use levels, they do appear to be able to detect dramatic changes in use over time. 
|
The NHS's estimates of the number of heavy users have been consistently lower than estimates based on other data sources. In 2000, the NHS extrapolated that there were approximately 450,000 total heavy cocaine users in the United States, yet other surveys estimate the number to be over three million for the same period, more than five times the NHS estimate.20
Because of these issues, no single survey can be assumed to produce reliable use rates where large portions of the users are in hard-to-survey populations.
Refusal to Participate
Another related confound stems from people refusing to participate in surveys. Though nearly all drug use surveys are technically voluntary, various levels of persuasion and coercion are used to encourage participation. Because people who use psychoactives may refuse at different rates than non-users, a higher refusal rate may lead to results less representative of the general population.For many surveys it is difficult to separate "refusal" rates from "miss" rates (the rate at which people unintentionally fail to participate); people may intentionally but passively refuse by being late, not answering their door, or not attending school at the time of the survey.
The explicit refusal rate varies widely from survey to survey, ranging from 1.5% for MTF to 14.5% for the NHS.21,22 A variety of factors may influence these refusal rates; for example, older people are less likely to agree to participate than younger people. According to the NHS, those 17 or younger had a refusal rate of only 2% in 2004, which, when combined with the parental refusal rate of 6.2%, equaled 8.4%. This is only half of the 16% refusal rate for those 18 and over.22 It remains unknown whether people who use unapproved psychoactive drugs are more likely to refuse than those who do not, but it seems likely.
The total combined miss and refusal rates for most drug use surveys varies between about 15% and 55%. This represents the total percentage of selected respondents who did not complete a valid survey, and therefore were not represented in survey results.
Most Studies Are Not Validated
Unfortunately, few of the surveys that measure psychoactive use have any direct validation of results. They can be compared against other data sources, but results have no direct connection to actual use. Though alcohol and tobacco surveys have similar problems, they also have two advantages: the legal status of their subject matter provides less reason for misreporting, and fairly reliable data from industry sales can be used to validate approximate consumption levels.The only available validation for survey data about illegal drug use would be hair tests that could detect a variety of drugs used in the last month or two. Widespread hair testing presents technical, legal, and ethical challenges that make it nearly impossible to implement within a democratic society. Without a direct connection between self-reporting and actual use, survey results remain, at best, rough estimates of trends in use of psychoactives, at the mercy of an array of poorly understood confounding factors.
Official reports of survey results make a variety of claims about the accuracy of their prevalence estimates; however, all claims about validity are based on the unsupported assumption that nearly everyone truthfully reports their own illegal drug use. The main argument offered by MTF report authors is that the data is self-consistent and changes slowly from year to year. What they have shown is that their instrument is fairly reliable at showing whatever it is the instrument measures, but they have failed to show that the instrument measures rates of actual drug use. This is not to say that the surveys are completely inaccurate, but the results presented in the survey reports would be far more accurately represented as a range of possible values instead of a single number. Although it is simpler to say that 69% of 30-year-olds have ever tried an illicit drug, the fact is that no one knows how accurate this number is and there is currently no method of finding out.

International Comparisons
It is not uncommon for newspapers or even government agencies to attempt to compare rates of psychoactive use between different countries. When two surveys of the same population can lead to significantly different results, a meaningful comparison of different surveys from different countries is effectively impossible because of variations in both methodologies and populations. Looking at other large, English-speaking countries, neither Canada nor Britain conducts long-term, nation-wide surveys about psychoactive use. The main surveys in those countries are not comparable in methodology or implementation to any of the top U.S. surveys.International comparisons of drug use levels are often made in order to debate the relative effectiveness of different drug policies, but the tentative nature of nation-wide use estimates based on survey data makes only the very broadest of comparisons possible.
Unscientific and Biased Surveys
Statistics reported by news sources are sometimes based on survey data collected unscientifically by biased organizations. Politically-driven groups such as CASA or the Partnership for a Drug Free America publish survey results that major news agencies report on. The media often fails to distinguish between scientific research and partisan surveys.In April 2005, media companies trumpeted a new "study" that showed that prescription drug abuse was beginning to overshadow illegal drug use among teens. Of a dozen news stories on the topic, none mentioned that the "research" had been designed and conducted by a commercial marketing firm hired by the extremely partisan and prohibitionist organization Partnership for a Drug Free America.25
Presentation and Interpretation
Perhaps the largest overall problem with psychoactive-related surveys is not a problem with the data itself, but with how the results are (mis)used and (mis)understood. The datasets generally say very little by themselves and require interpretation to be meaningful to most people. This process of interpretation and reporting may result in more distortion than the rest of the data problems combined. Overstating reliability, taking numbers out of context, ignoring conflicting results, suggesting causality where there is only correlation, and other simple techniques can be (and are) used to make the data support just about any rhetorical or political point.Even when survey authors try to present their results neutrally, the complex statistical calculations involved can both obscure meaningful facts and trends as well as falsely identify non-existent facts and trends. Consequently, these authors provide complicated descriptions of methodology, known problems, and numerous qualifications about not misusing or misunderstanding the nature of the data. Unfortunately, these technically-oriented caveats are seldom read and even more rarely mentioned when using results from a given survey to support a particular viewpoint.
The vast majority of people who hear statistics about levels of psychoactive use are exposed to them through breathless news stories about the problems of "drug abuse", usually in the context of scary increases in use or claimed decreases in use attributed to some new enforcement policy.
Reading the news, it can be extremely difficult to sort out whether reported data is the result of valid research, what the actual findings of a study are, who put together the "conclusions" that are reported in the media, and, perhaps most importantly, whether these (often politically motivated) conclusions are reasonable.
To say that the newstainment industry is driven by stories designed to shock and scandalize viewers has become cliché. Moderation or the boringly level "trends" of psychoactive use over the past 30 years are almost never in the news.
The combination of the illegality of the activity, the explicit governmental and political desire to change people's behavior, and the controversial nature of the subject make it impossible to trust most of what is reported as "factual" drug use statistics. Readers are encouraged to keep these issues in mind when reading about new studies, surveys and data regarding psychoactives and their use.
see also: Part I: The Sources
References #
- SAMHSA. Summary of Findings from the 2000 National Household Survey on Drug Abuse. 2000. Appendix B.3.
- SAMHSA, 2003. Appendix B.
- SAMHSA. 1997 National Household Survey: Main Findings. 1997. Appendix B.2.
- Gfroerer J, Eyerman J, Chromy J. "Redesigning an Ongoing National Household Survey: Methodological Issues." DHHS Publication No. SMA 03-3768. SAMHSA. 2002. 163.
- SAMHSA, 2000. Appendix B: Impact of Field Interviewer Experience on the 1999 and 2000 CAI Estimates.
- SAMHSA. 1999 National Survey on Drug Abuse. 1999. Appendix D.
- Hser Y. "Self-Reported Drug Use: Results of Selected Empirical Investigations of Validity" The Validity of Self-Reported Drug Use. NIDA. Research Monograph 167. 1997. 335.
- Gustafson P. "Officials angered by St. Paul officers posing as census takers." Star Tribune. Jun 30 2000.
- Johnson, 2005.
- Johnston LD, O'Malley PM, Bachman JG, et al. Monitoring the Future National Survey Results on Drug Use, 1975-2004. Vol I. NIDA. 2005. 72.
- Harrison L, Hughes A. "Introduction." Validity of Self-Reported Drug Use. NIDA Research Monograph 167. 1997. 4.
- SAMHSA, 2003. 109.
- Johnston, 2005 Vol II. 97-116.
- Johnston LD, O'Malley PM. "The Recanting of Earlier Reported Drug Use by Young Adults." The Validity of Self-Reported Drug Use. NIDA Research Monograph 167. 1997. 59.
- Johnston LD, Bachman JG, O'Malley PM. Monitoring the Future: Questionnaire Responses from the Nation's High School Seniors, 1995. Ann Arbor, MI: Institute for Social Research. 1996.
- Johnston, 2004 Vol I. Appendix A, Table A.2.
- Johnston, 2005 Vol I. Appendix A: Dropout/Absentee Adjustments.
- Fendrich M, Johnson T, Wislar J, et al. "Validity of drug use reporting in a high-risk community sample." Am J Epidemiol. 1999;149(10):955:62.
- Rhodes, Endnote 4.
- Rhodes, Table 3.
- Johnston, 2005. Vol I.
- SAMHSA. 2004 National Survey on Drug Use & Health. 2004. 142.
- SAMHSA. Results from the 2004 National Survey on Drug Use and Health: Detailed Tables. 2004. Table 4.6A.
- "Club Drugs, 2002 Update." The DAWN Report. DAWN. Jul 2004. 3.
- The Partnership for a Drug-Free America. Partnership Attitude Tracking Study: Teens 2004. Apr 21, 2005. PDFA. 5.


